Page 13 - Memoria 2017
P. 13

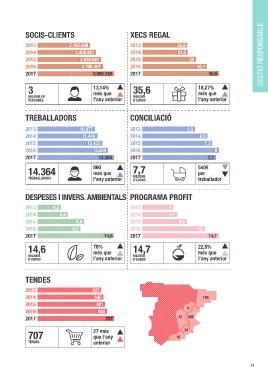
SOCIS-CLIENTS                                  XECS REGAL


            2013                2.165.648                  2013                 20,9
            2014                   2.405.951               2014                 21,2                                  GESTIÓ RESPONSABLE
            2015                     2.630.687             2015                      25
            2016                     2.705.307             2016                          30,1
            2017                          3.060.720        2017                               35,6

              3                            13,14%           35,6                         18,27%

              MILIONS DE                   més que          MILIONS                      més que
              PERSONES                     l’any anterior   D’EUROS                      l’any anterior


            TREBALLADORS                                   CONCILIACIÓ


            2013                     10.977                2013                     5,5
            2014                      11.449               2014                           6,8
            2015                        12.433             2015                             7,3
            2016                          13.504           2016                                 8
            2017                             14.364        2017                              7,7

              14.364                      860               7,7                          540€
                                          més que
                                                                                         per
              TREBALLADORS                l’any anterior    MILIONS                      treballador
                                                            D’EUROS

            DESPESES I INVERS. AMBIENTALS PROGRAMA PROFIT

            2013         4,5                               2013             6
            2014            5,8                            2014             6,7
            2015                   8,9                     2015                  8,6
            2016                 8,2                       2016                          12
            2017                               14,6        2017                               14,7

              14,6                        78%               14,7                         22,5%

              MILIONS                     més que           MILIONS                      més que
              D’EUROS                     l’any anterior    D’EUROS                      l’any anterior


            TENDES

            2013                          625
            2014                           646                                             186
            2015                            661                                     4
            2016                             680
            2017                                707                             41  426


              707                         27 més                               16  34
                                          que l’any
              TENDES                      anterior


                                                                                                                11
   8   9   10   11   12   13   14   15   16   17   18